|
WorcesterThen: 1867-1930
Nationalities of the Parents of Pupils in Worcester Schools 1867-1930 Beginning in 1867, the report of the Superintendant of Worcester Public Schools included a summary of the nationalities of the parents of the pupils, defined simply as the country of their birth. There was no explanation given regarding methods as to how the data were collected, or what the single code for a pupil was when the two parents differed in their places of birth. One can guess that they might have used the birthplace of the mother, but it is just that – a guess. No greater specification is attainable, so that weakness in the dataset has to be accepted. However, in the early years especially, and probably well into the 20th century, one parent’s nationality was very likely the same as the other in most cases, major exceptions being when one was born abroad in the “old country” while the other was born in the U.S. of parents from the old country. In most such cases, of course, the basic ethnicity of the child, in terms of language, social norms, and the like, would be the same anyway. In any case, this weakness in the data has to be accepted in order to try to ascertain any value in what the data show.
|
|||||||
|
|
This tabular dataset for 1870 shows that the numbers of children whose parents were from other countries was already well over half, and that Ireland alone accounted for the parentage of more pupils than did the United States. There undoubtedly were a small number of pupils whose parents were distinctly of one or another of the groups, especially Irish, but who were born in the U.S. of parents of very early immigrants.
For five-year-olds in the equivalent of today’s kindergarten, the youngest of their parents likely would be age 25 or over, and most would have been about 30-45, thus born 1825-1840, predating the major Irish immigration which stemmed from the famine in Ireland, and falling into the date range of the Irish workers who came to build the canal and stayed to build |
||||||
|
the railroads. Although significant, the numbers of those early immigrants from Ireland were small compared with those of the 1840s and 1850s. Thus, some, but only a relatively small number, of Irish-American pupils in 1870 were of parents born in the U.S. As the years rolled on that would change, of course. In 1870, most, but not all, of the parents born in the U.S. were of the old English and Scots-Irish stock that dominated the town in its early days, along with small numbers of others, including Blacks and immigrants from England. But in the coming years the numbers of second generation children would increase and the “born in the U.S.A.” group would start becoming increasingly diversified. Although not shown here, the older the pupils the lower the proportion of foreign-born parents, because the immigrants arriving would tend to be younger and to have younger children. Most high school students, for example, would have parents in their forties or fifties, meaning the chances of having been born abroad were that much less (ca. 1810-1830). The effect would diminish in time, of course. |
|||||||
|
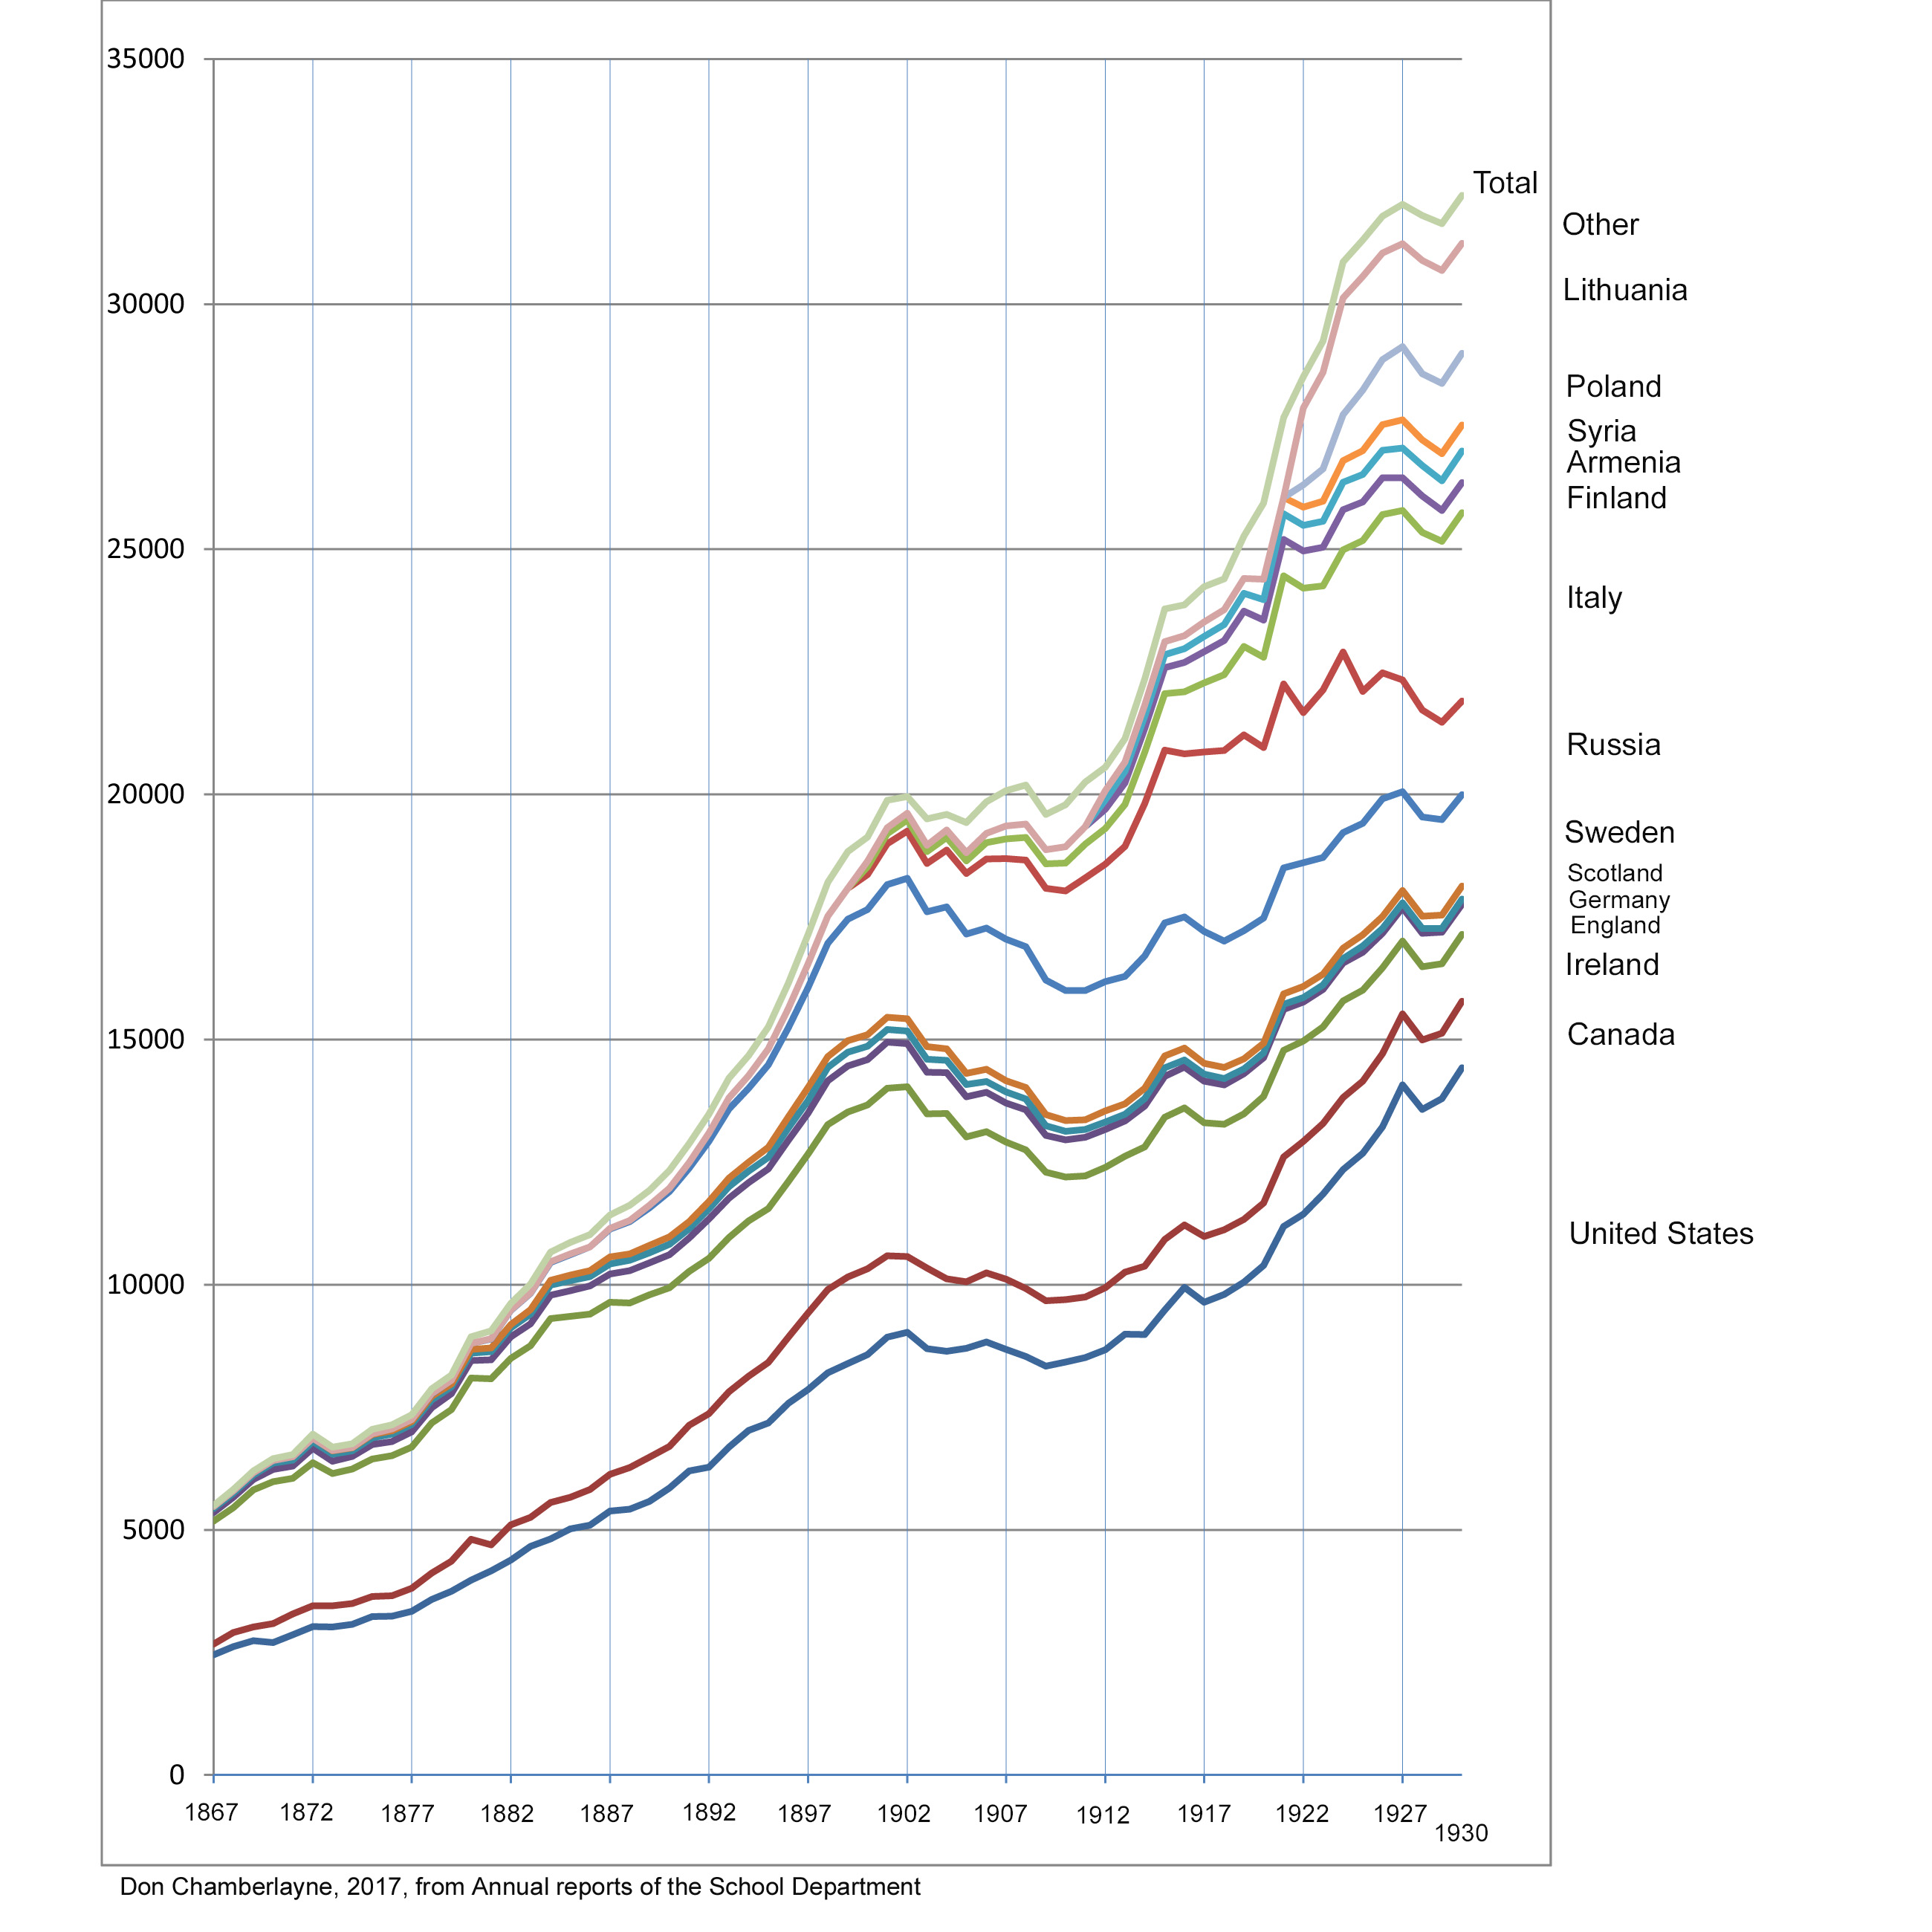
The line chart below represents data collected by the school department from 1867 through 1930. The data as displayed are cumulative, meaning the nationality groups are stacked upon each other such that the top line represents the total, and the spaces between the lines represent numbers of pupils in the categories.
Each nationality group has a color, and its numbers for each year are represented by the gap between the two lines – the country’s own line and the one below it. For example, children of Russian-born parents in 1930 appear to number a bit below 2,000, as reflected in the gap between the red line for Russia and the blue line for Sweden. A similar, slightly smaller, number appears that year for pupils of parents born in Sweden. (In the Excel spreadsheet containing the data (see below), it can be seen that there were 1,909 pupils of Russian-born parents and 1,862 of Swedish-born parents in 1930.) .
|
|
|
Children Enrolled in Public Day Schools in Worcester by Country of Birth of their Parents
|
|
|
Some of the countries represented didn’t enter the picture until later.
The dataset started with six countries, including the United States, plus “other” in 1867. Besides the U.S. the countries were Canada (mostly French-Canadians but also small numbers from Nova Scotia, New Brunswick, and Newfoundland); Ireland (by far the largest group); England; Germany; and Scotland. Almost all of the Irish and French-Canadian families would have been of the Roman Catholic faith, while most of the others would have been of one or another protestant denomination. By 1867, as measured by pupils in the schools, Catholics already matched the protestants in numbers.
Sweden was added in 1873, and Russia in 1878. The former were Protestants, and the Russian immigrants were mostly Jewish. Despite arrivals from other parts of Europe, the list of countries remained stable until 1900 when Italy and Finland were added. Then in 1912, Armenia and Syria were added to the list, and in 1922, Poland and Lithuania. These immigrations reflected the desire of many to leave that part of eastern Europe after the Great War in response to the rise of the Soviet Union.
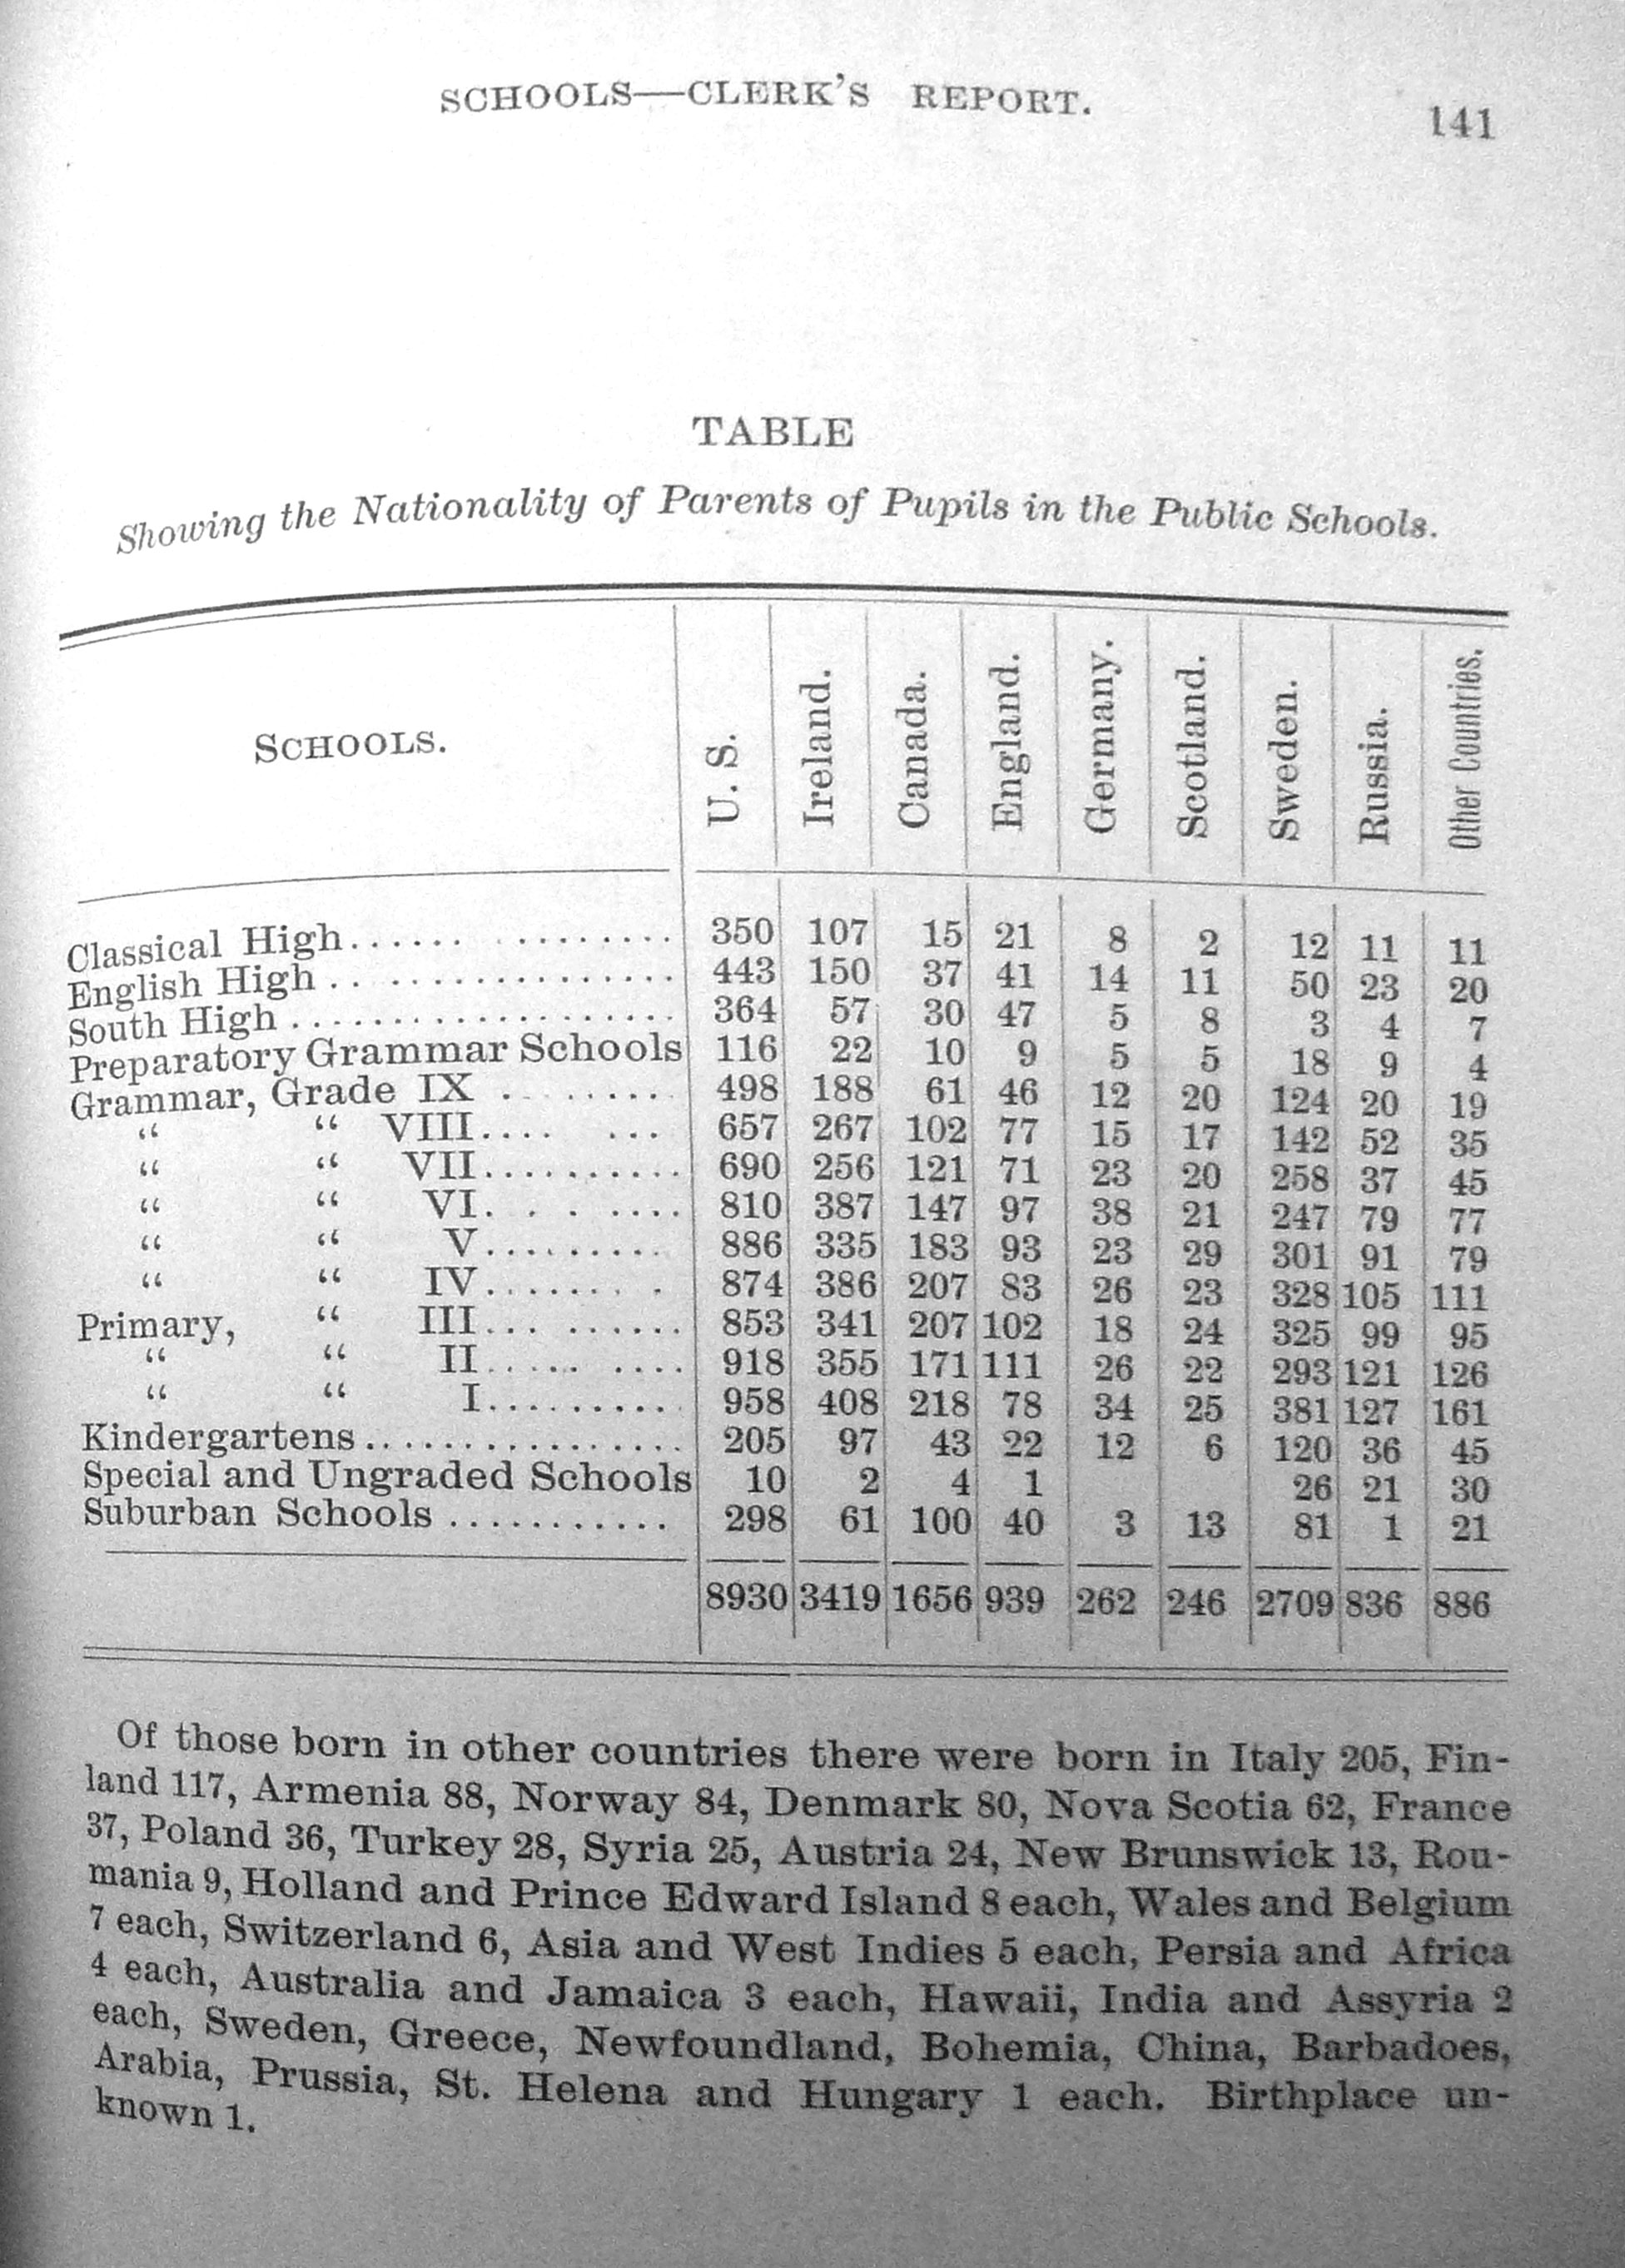
The other nationality category sometimes swelled to high levels before groups were taken out and given their own identification, as when the Poles and Lithuanians got their own counts in 1922. Additional detail regarding the other nationalities group can be found in footnotes to some of the superintendant’s reports. As an example, a complete list of other nationalities for 1901, totaling 564 pupils, can be found in the note under the table.
The proportion of pupils with parents born in the U.S. remained strikingly consistent throughout the 63-year period – between 40 and 48 percent of all pupils. By some date in the late 1870s or early 1880s, the numbers of second generation pupils had started increasing significantly, particularly at first the children of Irish grandparents, and their numbers began to contribute substantially to the category of parents born in the U.S. By 1930 the native-born group almost surely consisted of a substantial majority of children of U.S.-born parents who were of second-generation ethnic identification, especially Irish, but gradually including substantial numbers of French Canadian, Russian Jewish, Lithuanian, Italian, and other groups.
Using the data in this way results in a potentially helpful way to visualize and imagine the fairly rapid assimilation of a high proportion of immigrants into Worcester during the latter third of the 19th century and the first third of the 20th. Nevertheless, to construct a reasonably accurate population distribution of Worcester by ethnicity on the basis of this data would be difficult, though not necessarily out of reach.
A useful research project for someone looking for a topic of modest scale and high value would be to interweave these data with figures from various federal censuses providing aggregate demographic statistics for the city. The school data offer much greater detail regarding countries of origin than does the census, and on a yearly basis. As noted, the difficulty comes in estimating the numbers of families on the basis of pupils in the public schools.
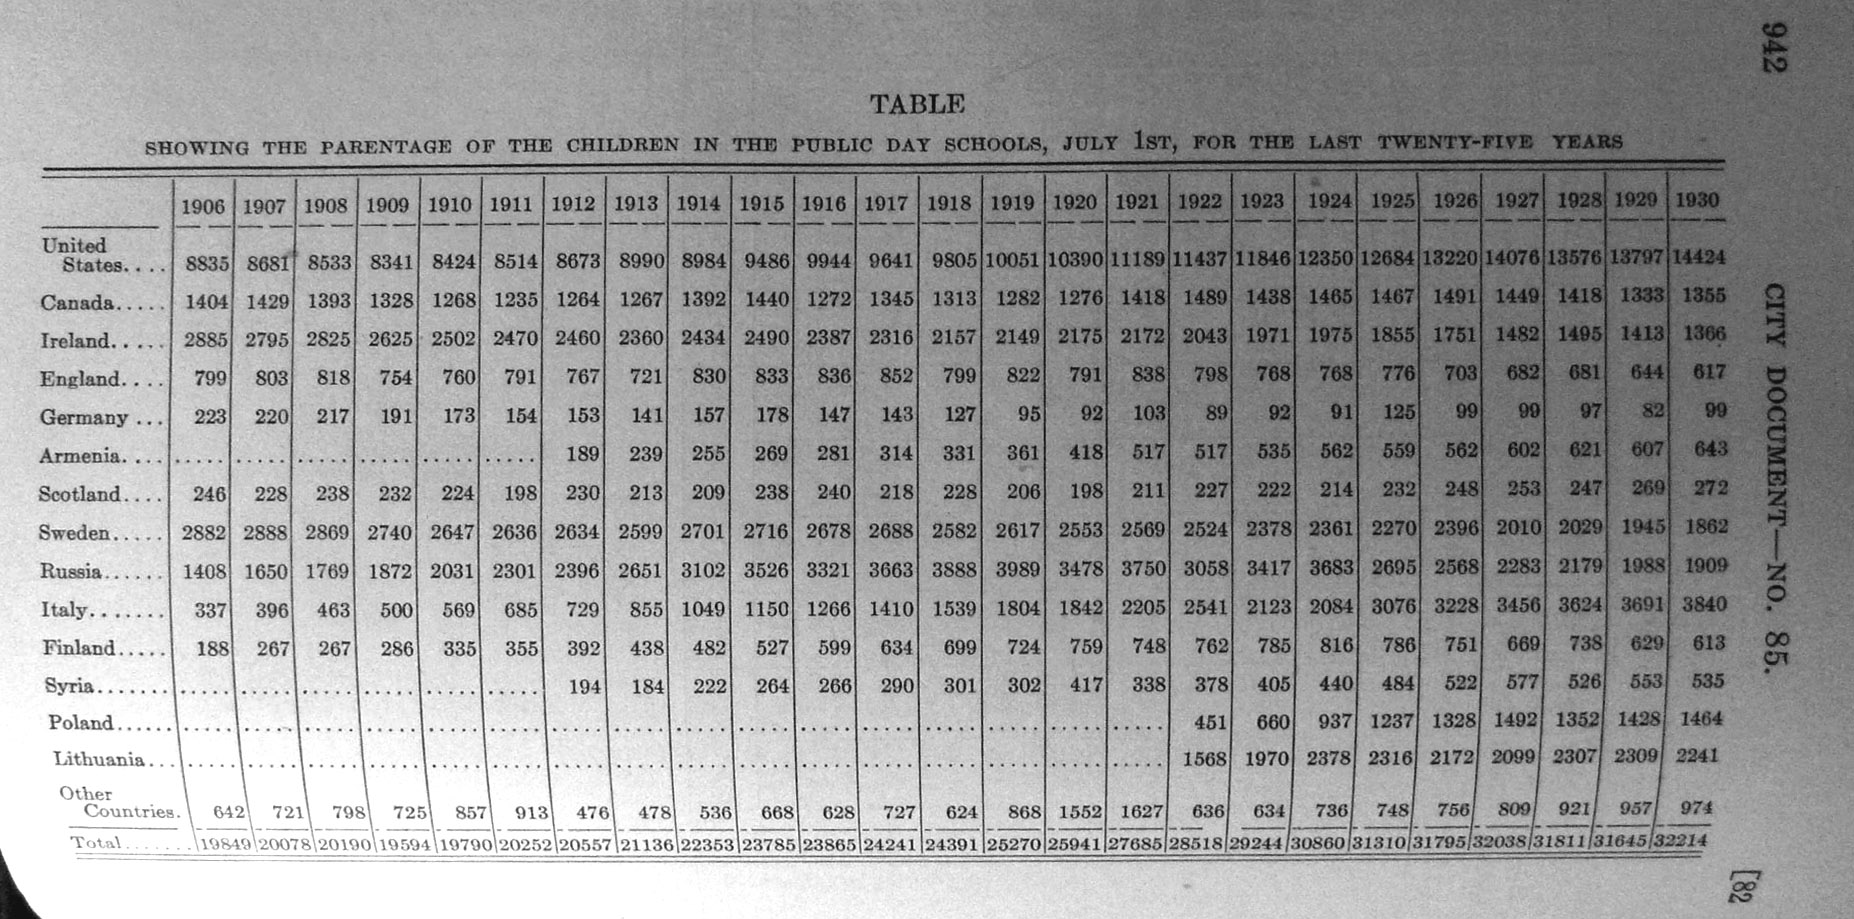
Here is the complete dataset, in the form of an Excel spreadsheet. Here is a sample page from City Documents showing nationality data for 1906-1930.
|
||